FREE RETAIL DASHBOARD TEMPLATE
Compare results against target and prior period using the included fictional Canadian retail data.
Google Sheets + Data Studio

2-PAGE DASHBOARD
Are we on or off plan?
See which core KPIs are on track, need attention or are off track against target and prior period.
How are acquisition and retention changing?
Review new customers, returning revenue share and conversion signals against the prior period.
What is driving revenue?
Compare revenue contribution across channels, SKUs, product categories, provinces and traffic sources.
What needs attention next?
Use performance status and executive signals to identify where further review is needed.
Scattered retail data
→
One consistent view
→
Target and prior comparison
→
Clearer performance signals
Bring existing retail data into one structured view to compare performance, spot gaps and decide where to investigate next.
What’s Inside the Dashboard

Executive Summary
Seven executive KPIs, performance vs plan, revenue vs target trend and three action-oriented business signals.
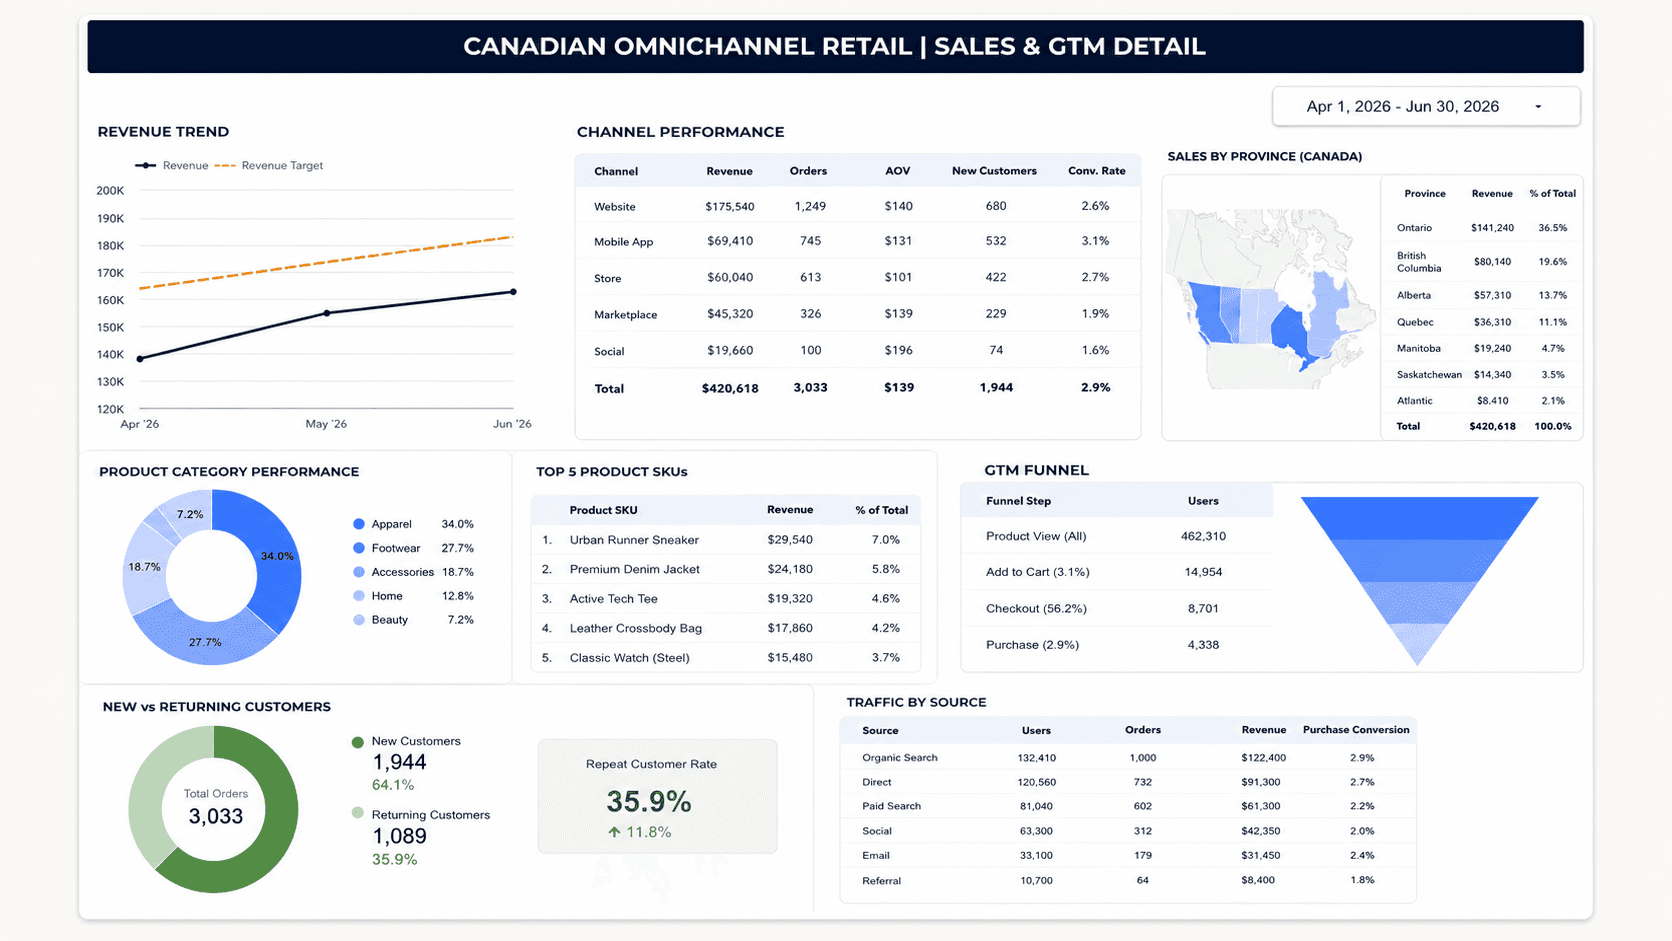
Sales & GTM Detail
Revenue trend, channel performance, sales by province, product categories, top SKUs, customer mix, traffic sources and the GTM funnel.

Structured Data Input
A supporting Google Sheets template with fictional demonstration data, targets and the structured fields required by the dashboard.
01
Make your copies
Open the data-input template and create your own Google Sheets copy.
02
Review the demo structure
Review the fictional data, target fields and required input format.
03
Replace the demo data
Add your own retail data using the same columns and structure.
04
Open the Data Studio report
Open the shared dashboard report using the Data Studio link provided below.
05
Make a copy and reconnect
Make your own report copy, then connect it to your copied Google Sheets file.
06
Select the period and review
Choose the reporting period, compare results and review the performance signals.
Important: The template has two connected components. Copy the Google Sheets input file and the Data Studio report, then reconnect your report copy to your own Google Sheets copy.
Data Studio does not connect automatically to every POS, ecommerce or CRM platform. Your source data must follow the provided structure.
Get the Complete Retail Dashboard Template
The template has two connected components. Copy both before replacing the fictional demonstration data with your own retail data.
STEP 1
Google Sheets Data Template
Copy the structured input file containing the demonstration data, target fields and required column format.
A Google account is required to create and edit your own copy.
STEP 2
Data Studio Dashboard
Open the interactive two-page report, make your own copy and reconnect it to your copied Google Sheets file.
In Data Studio, open the report menu and select Make a copy.
A Google account is required to create and edit your own copies. The original templates remain view-only.

Built by Kanokwan Kaewfah
Senior marketing and growth leader with 20+ years of experience turning commercial, customer and performance information into practical business decisions.